Introduction
Microsoft has just launched a very rich chart control for .NET web and Windows Forms applications. Let’s take a look at some features from it.Prerequisites
- Visual Studio 2008 SP1, click here to download the Service Pack!
- .NET Framework 3.5 SP1, click here to download!
- Microsoft Chart Controls, click here to download!
- Visual Studio 2008 Support Tool for the Chart Control, click here to download!
- Documentation, click here to download!
- Web and Windows application samples, click here to download!
Chart Types
The following chart types are available:- Bar and columns
- Line
- Area
- Pie and Doughnut
- Point
- Range
- Circular
- Accumulation
- Data Distribution
- Financial
Bind Types
The following options are available to be used as bind types for your application charts:- XML Files
- Excel Files
- CSV Files
- Arrays
IEnumerableobjects- Dataviews
How To...
The examples and documentation are really good and to work with the new Microsoft Chart control is very straightforward. Drag and drop a chart control, set properties in design and / or runtime and it’s done!Namespace
The namespace you are going to use isSystem.Web.UI.DataVisualization.Charting.Main Properties
ChartAreas: It is the area where a chart is plotted. Your chart may contain more than one chart area, that means you may plot more than one chart by render and you may even overlap charts.Series: It is the data you may plot on your chart area.ChartType: The chart type property is under theSeriesproperty and defines how your data series will be displayed on a chart area.Axes: Defines properties for the X and Y axes like appearance and titles.Palette: Defines the colors set for your chart.Titles: Defines text that may be used to describe a chart, an axis or any other part of the chart.Legends: Defines the legends that will display the data series information.Labels: Defines text that may be displayed close to axis, points and custom labels.
Examples
The following code uses two arrays to create a simple pie chart:double[] yValues = { 10, 27.5, 7, 12, 45.5};
string[] xNames = { “Mike”, “John”, “William”, “George”, “Alex” };
myChart.Series[0].Points.DataBindXY(xNames, yValues);Output: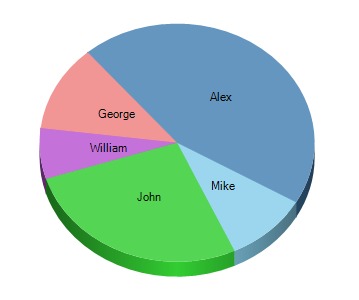
Picture 1: Pie chart created with array databind.
Using the same code but changing some values will produce the following bar chart: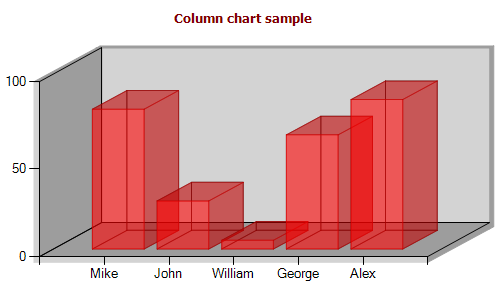
Picture 2: Column chart created with an array databind.
More Features
This new control set is really rich on the level of customization allowed. Some other features of the new Microsoft Chart control include:- Image plot or binary streaming rendering
- Allows a very complex set of data to be plotted
- 3D visualization control (perspective, angle, rotation)
- Events to give even more control over how to plot data, custom images, post plot actions and a click event
- May be used in conjunction with Ajax to create real time charts, use charts as trigger to load data
- Drill down chart with preview
- Image map selection
- Custom animated tooltips
- Capture of mouse events
No comments:
Post a Comment